When Building Gets Cheap
XKCD 1205 told us when automation was worth the time. AI collapsed that calculation. But the chart measured the wrong cost all along.
7 min readFor over a decade, one of the most widely shared references in operations and engineering culture has been XKCD 1205: Is It Worth the Time? It is a simple table. The columns show how often you do a task. The rows show how much time you would save per run. Each cell tells you how long you can spend automating before you spend more time than you save.
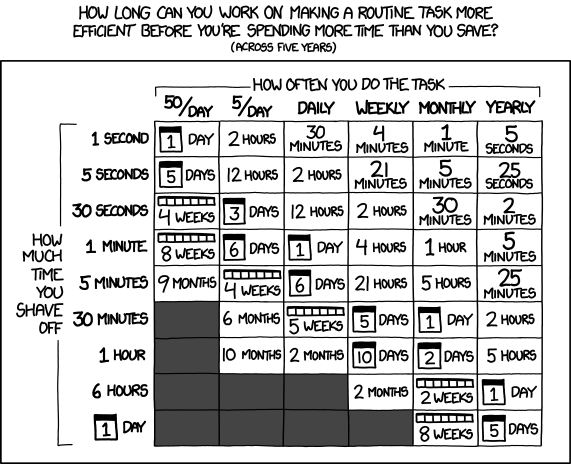
The chart became gospel. If you have ever heard someone say “that is not worth automating” in a standup, there is a good chance this table was what they were referencing, consciously or not. It was the sanity check against yak-shaving. The back-of-envelope argument for stopping the thing nobody asked for.
And then AI happened.
The Cost Side Collapsed
The chart has one implicit assumption: that building the automation takes meaningful time. Days, weeks, months. That assumption was reasonable when automation meant writing a script, testing it, handling edge cases, documenting it, and finding somewhere to host it. The cost side of the ledger was genuinely large.
That cost is now close to zero for a wide class of problems. A task that would have taken a full day to automate two years ago can be automated in twenty minutes today, often in less time than one manual run. The bottom-left corner of the chart, the cells that used to say “don’t bother,” has become viable.
This is the straightforward read, and it is not wrong. Plenty of people have pointed it out. Simon Willison frames it as the ability to ship projects that were never worth justifying before. The HN commentariat calls it the death of 1205. People have written about the chart being pushed down and to the right.
But I think that framing misses something. It treats the chart as correct-but-outdated, as if we only need to update the numbers. I think the chart was measuring the wrong cost all along.
Death by a Thousand Cuts
One phrase I hear constantly from operations leaders is death by a thousand cuts. A deterministic task that takes five or ten minutes a day, done by one person, does not lose anyone sleep. The chart says you can spend about six days automating it and break even over five years. That is a small budget. The task is small too, so it stays on the to-do list forever.
Now do the same math across thirty people on the same team. Five minutes a day times thirty people is 150 minutes of daily human effort. Across a year, that is 600 hours. The per-person share is still five minutes, but the organization is absorbing a full-time-equivalent cost and nobody feels it directly enough to act on it.
The chart is framed from the perspective of a single person deciding whether to automate their own task. In an actual organization, the work is distributed and the cost is distributed. Nobody feels enough pain individually to cross the threshold the chart suggests. Each cut is small. The aggregate is enormous. The aggregate was always what counted.
This is a big part of why so many deterministic, repetitive processes stay forever in the chart’s gray zone. Nobody has the view of the aggregate cost and the authority to act on it at the same time.
The Costs the Chart Never Counted
At Adyen, at DocuSign, at every ops-heavy company I have worked with, the question “is this worth automating?” was almost never answered by comparing hours. It was answered by organizational gravity.
Things did not get automated because:
- Nobody owned the problem. A task crossed three teams, so each team did its fractional piece manually. Nobody had the authority to build the thing that would have replaced all three pieces.
- The process was not legible. The person doing the task every day knew the edge cases in their head but could not describe them precisely enough for someone else to codify. So the knowledge stayed trapped.
- The automation would have required trust. Approving invoices, sending customer emails, touching pricing. The automation was technically cheap but organizationally expensive, because someone had to sign off on letting software do a thing humans currently did.
- The person doing the task was not the person who would build the automation. Ops did the work. Engineering had to build the fix. The handoff was where the project died.
None of these costs appear on the XKCD chart. The chart assumes you, a single engineer, are deciding whether to automate your own task. In practice, the costs of not automating were almost always absorbed somewhere outside the person who could have built the fix. The costs of automating were organizational more often than technical.
The chart was a useful heuristic for the 5% of cases where one engineer could make the call alone. It was nearly irrelevant to the 95% of ops work that crossed team boundaries.
AI Changed Who Can Build
If the expensive part was organizational, then making building cheap should not move the needle that much. And yet it clearly does. So what shifted?
The answer, I think, is that AI changed who can build. The handoff was the binding constraint. AI is the first tool that lets the person who understands the process be the person who builds the fix. A commercial operations lead who knows exactly why the invoice reconciliation is painful can describe it to an AI assistant and get a working tool. They do not have to negotiate for engineering attention. They do not have to translate their process into a ticket and hope.
This is why the chart’s axes are still wrong, even after you recalibrate the cost side. The chart asks “is it worth your time?” But the question that counted was always “who has the combination of context, authority, and capability to make this happen?” For decades, those three things were almost never in the same person. AI is the first tool that routinely puts them together.
The New Question
If building is cheap and the person with the context can do the building, then the question changes. “Is it worth the time?” becomes trivial in most cases. The harder questions are the ones the chart never asked:
Should this exist? Every automation you build is a thing you now maintain, debug, explain, and potentially retire. Cheap to build does not mean cheap to own. A newly viable bottom-left corner does not mean you should fill it.
Who else needs this? A skill solves your problem. An application solves a team’s problem. An automation that makes sense for one person does not automatically make sense productionized for ten. I wrote about this progression in When Your Skill Needs to Graduate.
What breaks if this is wrong? An automation that generates a first draft is low-stakes. An automation that sends an email to a customer is not. The verification cost per run is part of the calculus the chart never included. It does not scale with how cheap the automation was to build.
Automate the process, or rethink it? Sometimes the manual work exists because the process is bad. Automating a bad process only makes it faster. The cheapest automation is the one where you delete the step instead of encoding it.
The Same Pivot, Three Times
Across the three articles I have written so far, the same pivot keeps showing up: as building gets cheaper, judgment gets more expensive. The spreadsheet-to-application piece was about knowing when a sheet has outgrown its container. The skills piece was about knowing when a personal tool needs to become a shared one. This one is about knowing whether to build the thing in the first place.
The XKCD chart answered one question well: if you are one engineer with a clear task, should you automate it? That question is mostly solved now. The questions that remain are harder, and they are the ones ops and commercial teams have always been asking. They did not have the tools to act on the answers. Now they do.
Which means the bottleneck is no longer building. It is deciding.
If you are thinking through what your team should and should not be automating, or want a second opinion on which of your manual processes deserve to exist at all, reach out at [email protected].